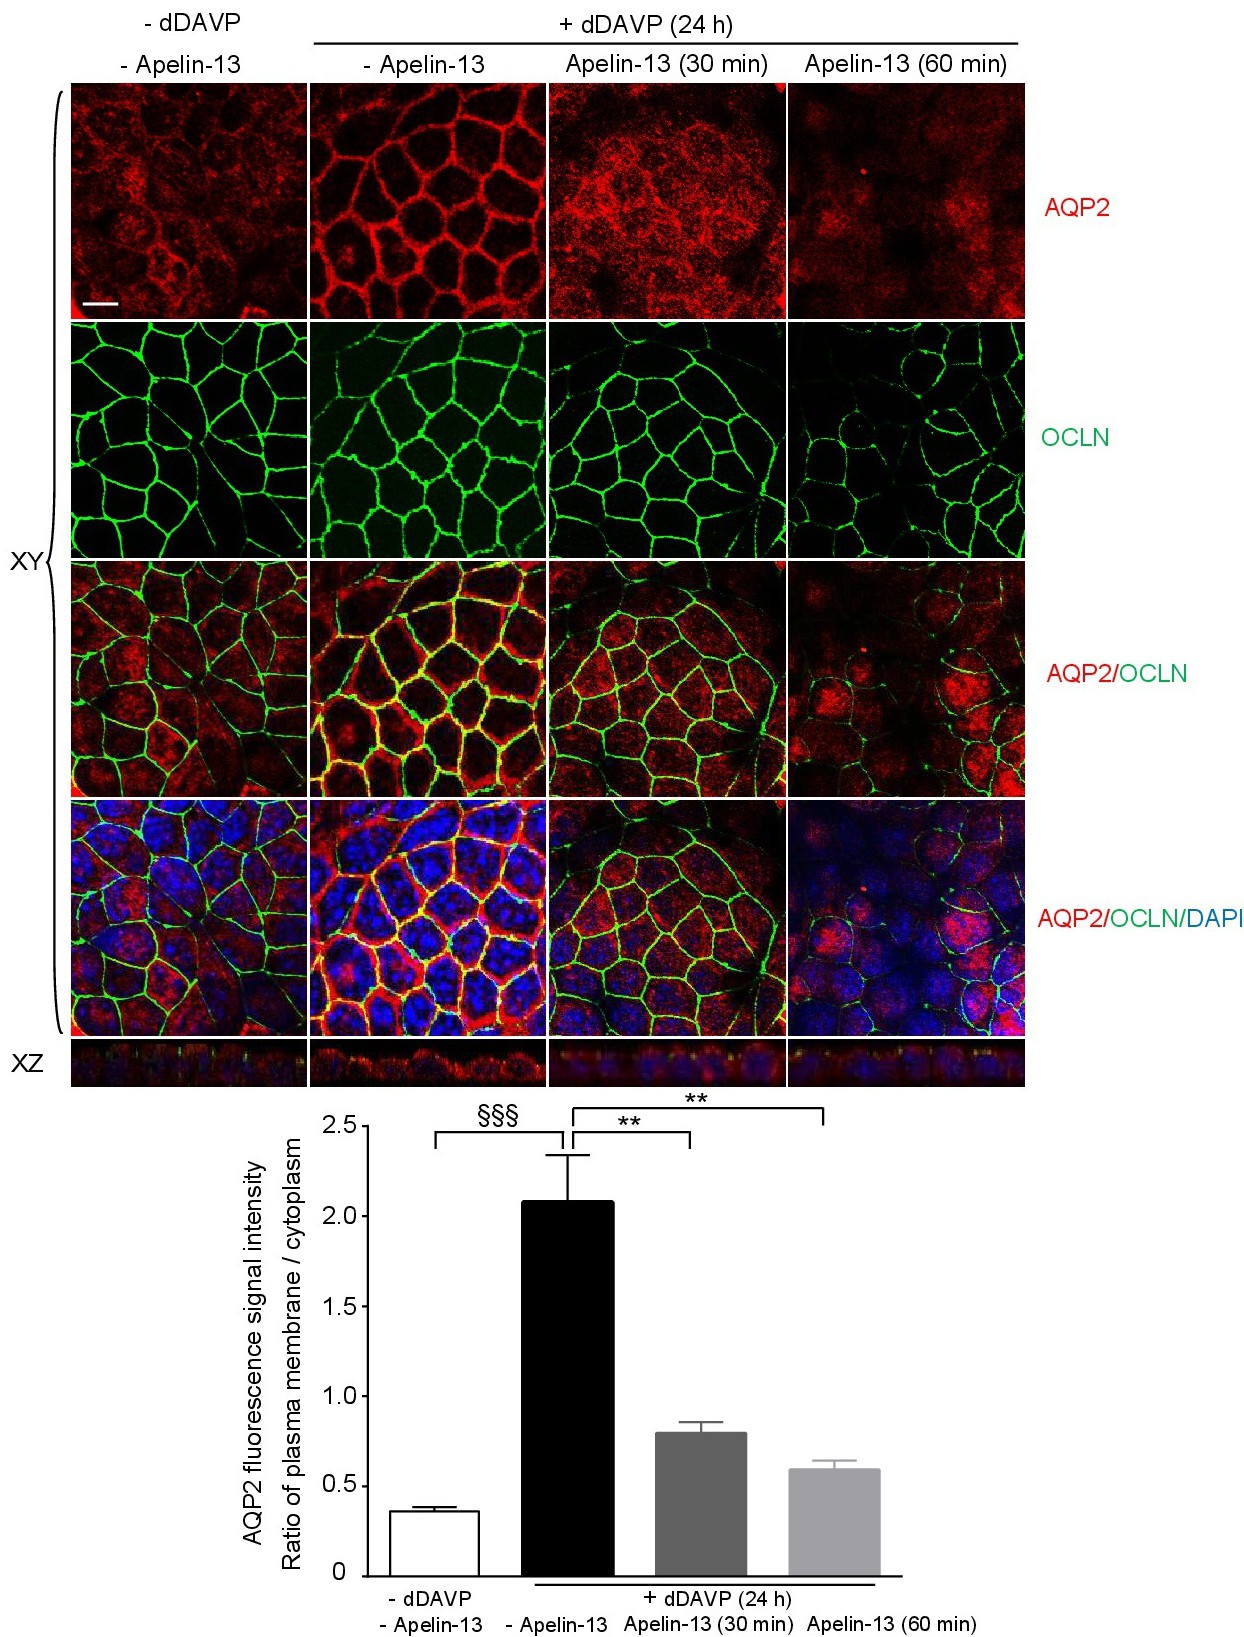
Fig. 5. AQP2 immunolocalization in response to AVP and apelin-13 treatment. mpkCCDc14 cells grown on permeable supports were left untreated (negative control, 1st column) or treated with dDAVP for 24h (positive control, 2nd column) or with a combination of dDAVP and apelin-13 (for 30 or 60 min, 3rd and 4th columns). Double immunofluorescence labeling was performed, using an antibody recognizing all forms of AQP-2 (red) for total-AQP2 and an antibody targeting occluding (OCLN, green). OCLN, located at the tight junctions in sub-apical membrane, was used as a cytoplasm membrane marker while nuclei were stained with DAPI (blue). Confocal images are shown in both XY and XZ plans. Scale bar = 5 µm. Localization of AQP2 was expressed as the ratio of fluorescence signal intensity at the plasma membrane to intracellular fluorescence signal intensity. Analysis of AQP2 represents the means ± SEM of four independent experiments. §§§ p< 0.001; **p<0.01; compared to dDAVP treatment (two-way ANOVA with a posthoc Bonferroni multiple comparison test).